- The Formula Notebook
- Posts
- Vertical Bar Graph

This all started when Ziki and Purple Notion launched their Notion Formulas 2.0 30-day challenge.
They shared Aka Notion’s histograms with me.
I thought “If that can be done, vertical bars should be possible”.
I created a new Notion page, added a database with a few random values, and linked to another database with a formula field.
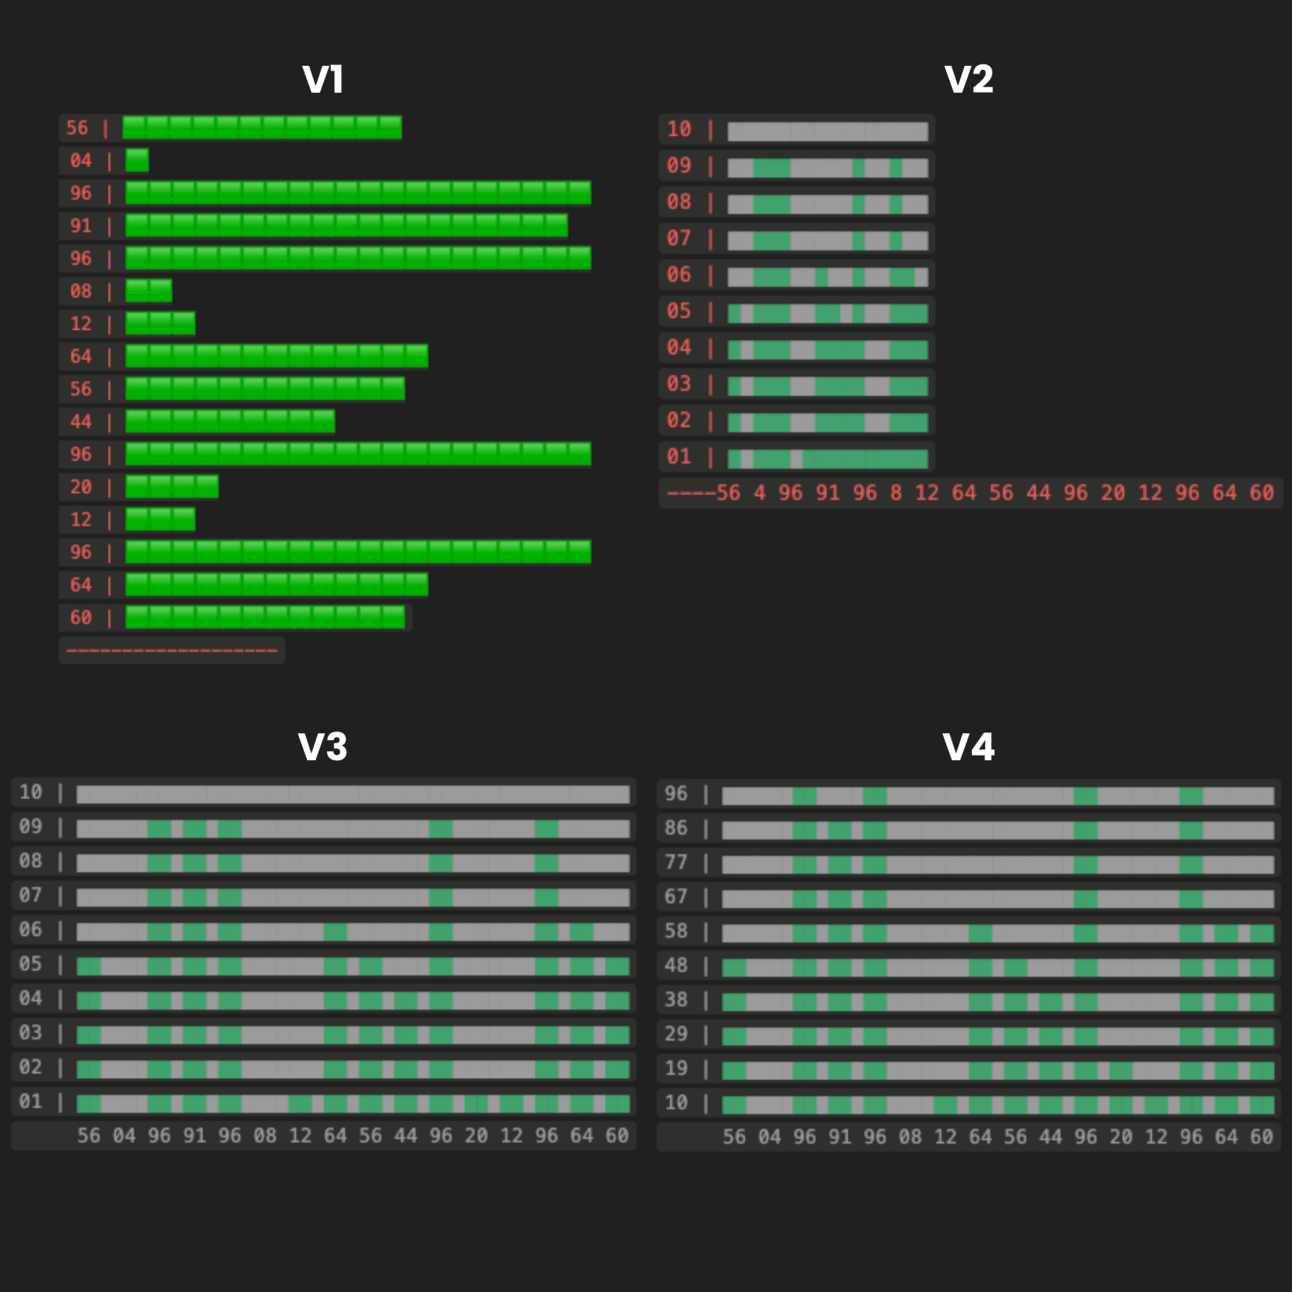
V1 was the proof of concept. “If I can make this work, the rest is just formatting.”
In V2 I was able to make it vertical and changed the symbol to make it easier to format.
In v3 I was able to make the numbers align with the bars and added padding so the numbers are not all together.
In V4 it was mostly improvements and cleaning up the formula. I thought that was it.
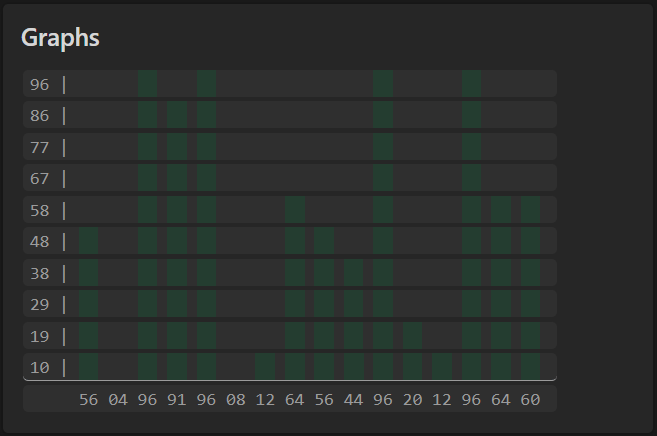
But then I took a closer look at Aka_notion’s histograms and saw he was using spaces and it looked better.
I wanted that too.
It took a few tries but finally got it working.
I also added an underline to the last row so it serves as a base for the graph.
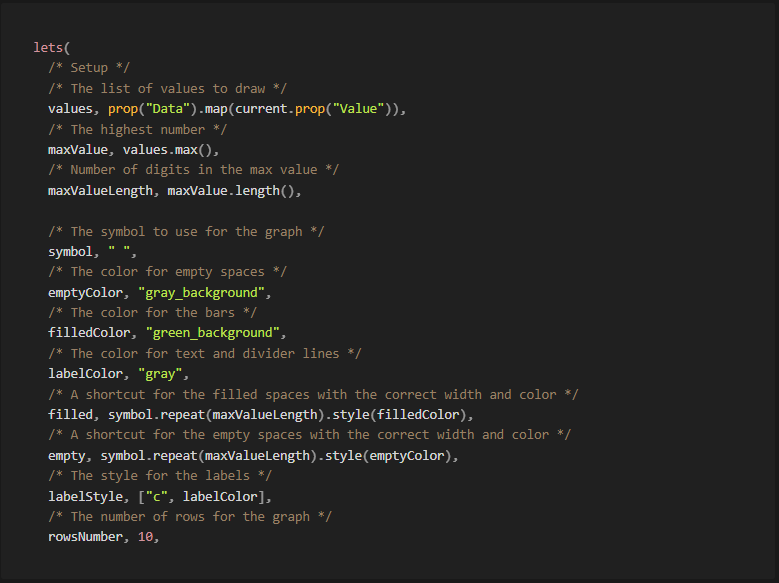
So, what you came for, the Formula:
In the first section, everything is pretty much self-explanatory, just a bunch of definitions to make the code easier to work with.
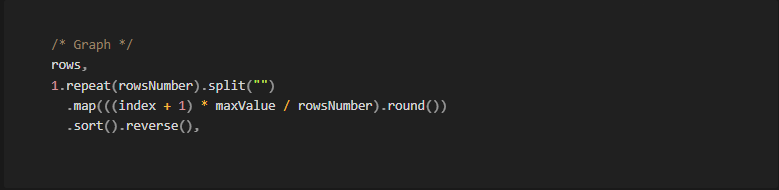
Now we’ll create the rows.
We define any placeholder symbol by the number of rows we want and split it into a list. Then we map that to create a scale with rowsNumber steps proportional to the maxValue, sort it, and reverse so the biggest number is on top.
Now where the real magic happens.
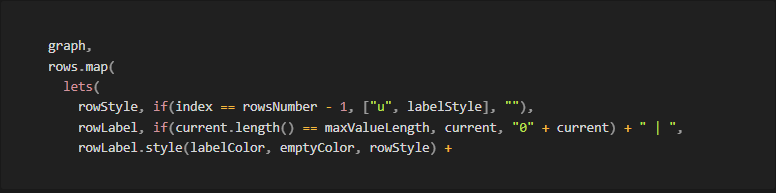
We start mapping the rows to fill with the appropriate color.
First, we define the style for the underlined last row, the label with the column value, and add the style.
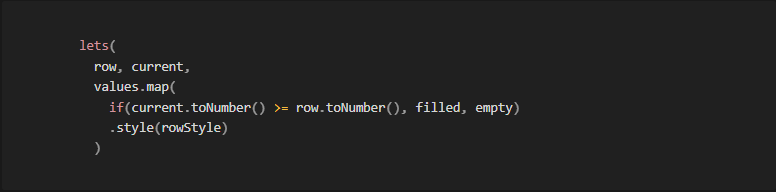
For the color of the bars, we go through the values in each row and add either a filled or an empty symbol by comparing the value of the column and the row.
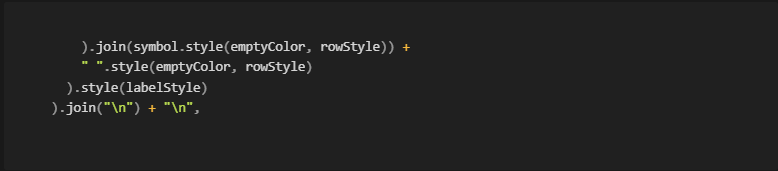
Now we join all the symbols in each row with an empty space to allow space for the numbers in the bottom. Add an empty space to each row for padding, set labelStyle so it’s all the same color and width, and add line breaks at the end of each row.
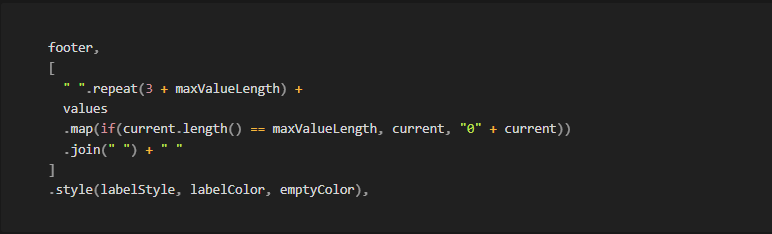
For the footer, we will add padding to give space for the numbers on the left.
Then add all the numbers joining with a space between them.
And a final space for padding on the right.
Finally, return the graph and the footer from the outer lets.
If you want to see the formula working and play around with it, you can find it here: Graph
If you have any comments or questions, feel free to reply to this email or DM me on X.
An open challenge, should you choose to accept it:
Bigger numbers may break the design of the graph as the rows won’t fit a line in the Notion property field.